Citizens Information Services (CISs) National Statistics 2023
Citizens Information Services (CISs) National Statistics 2023

Overview
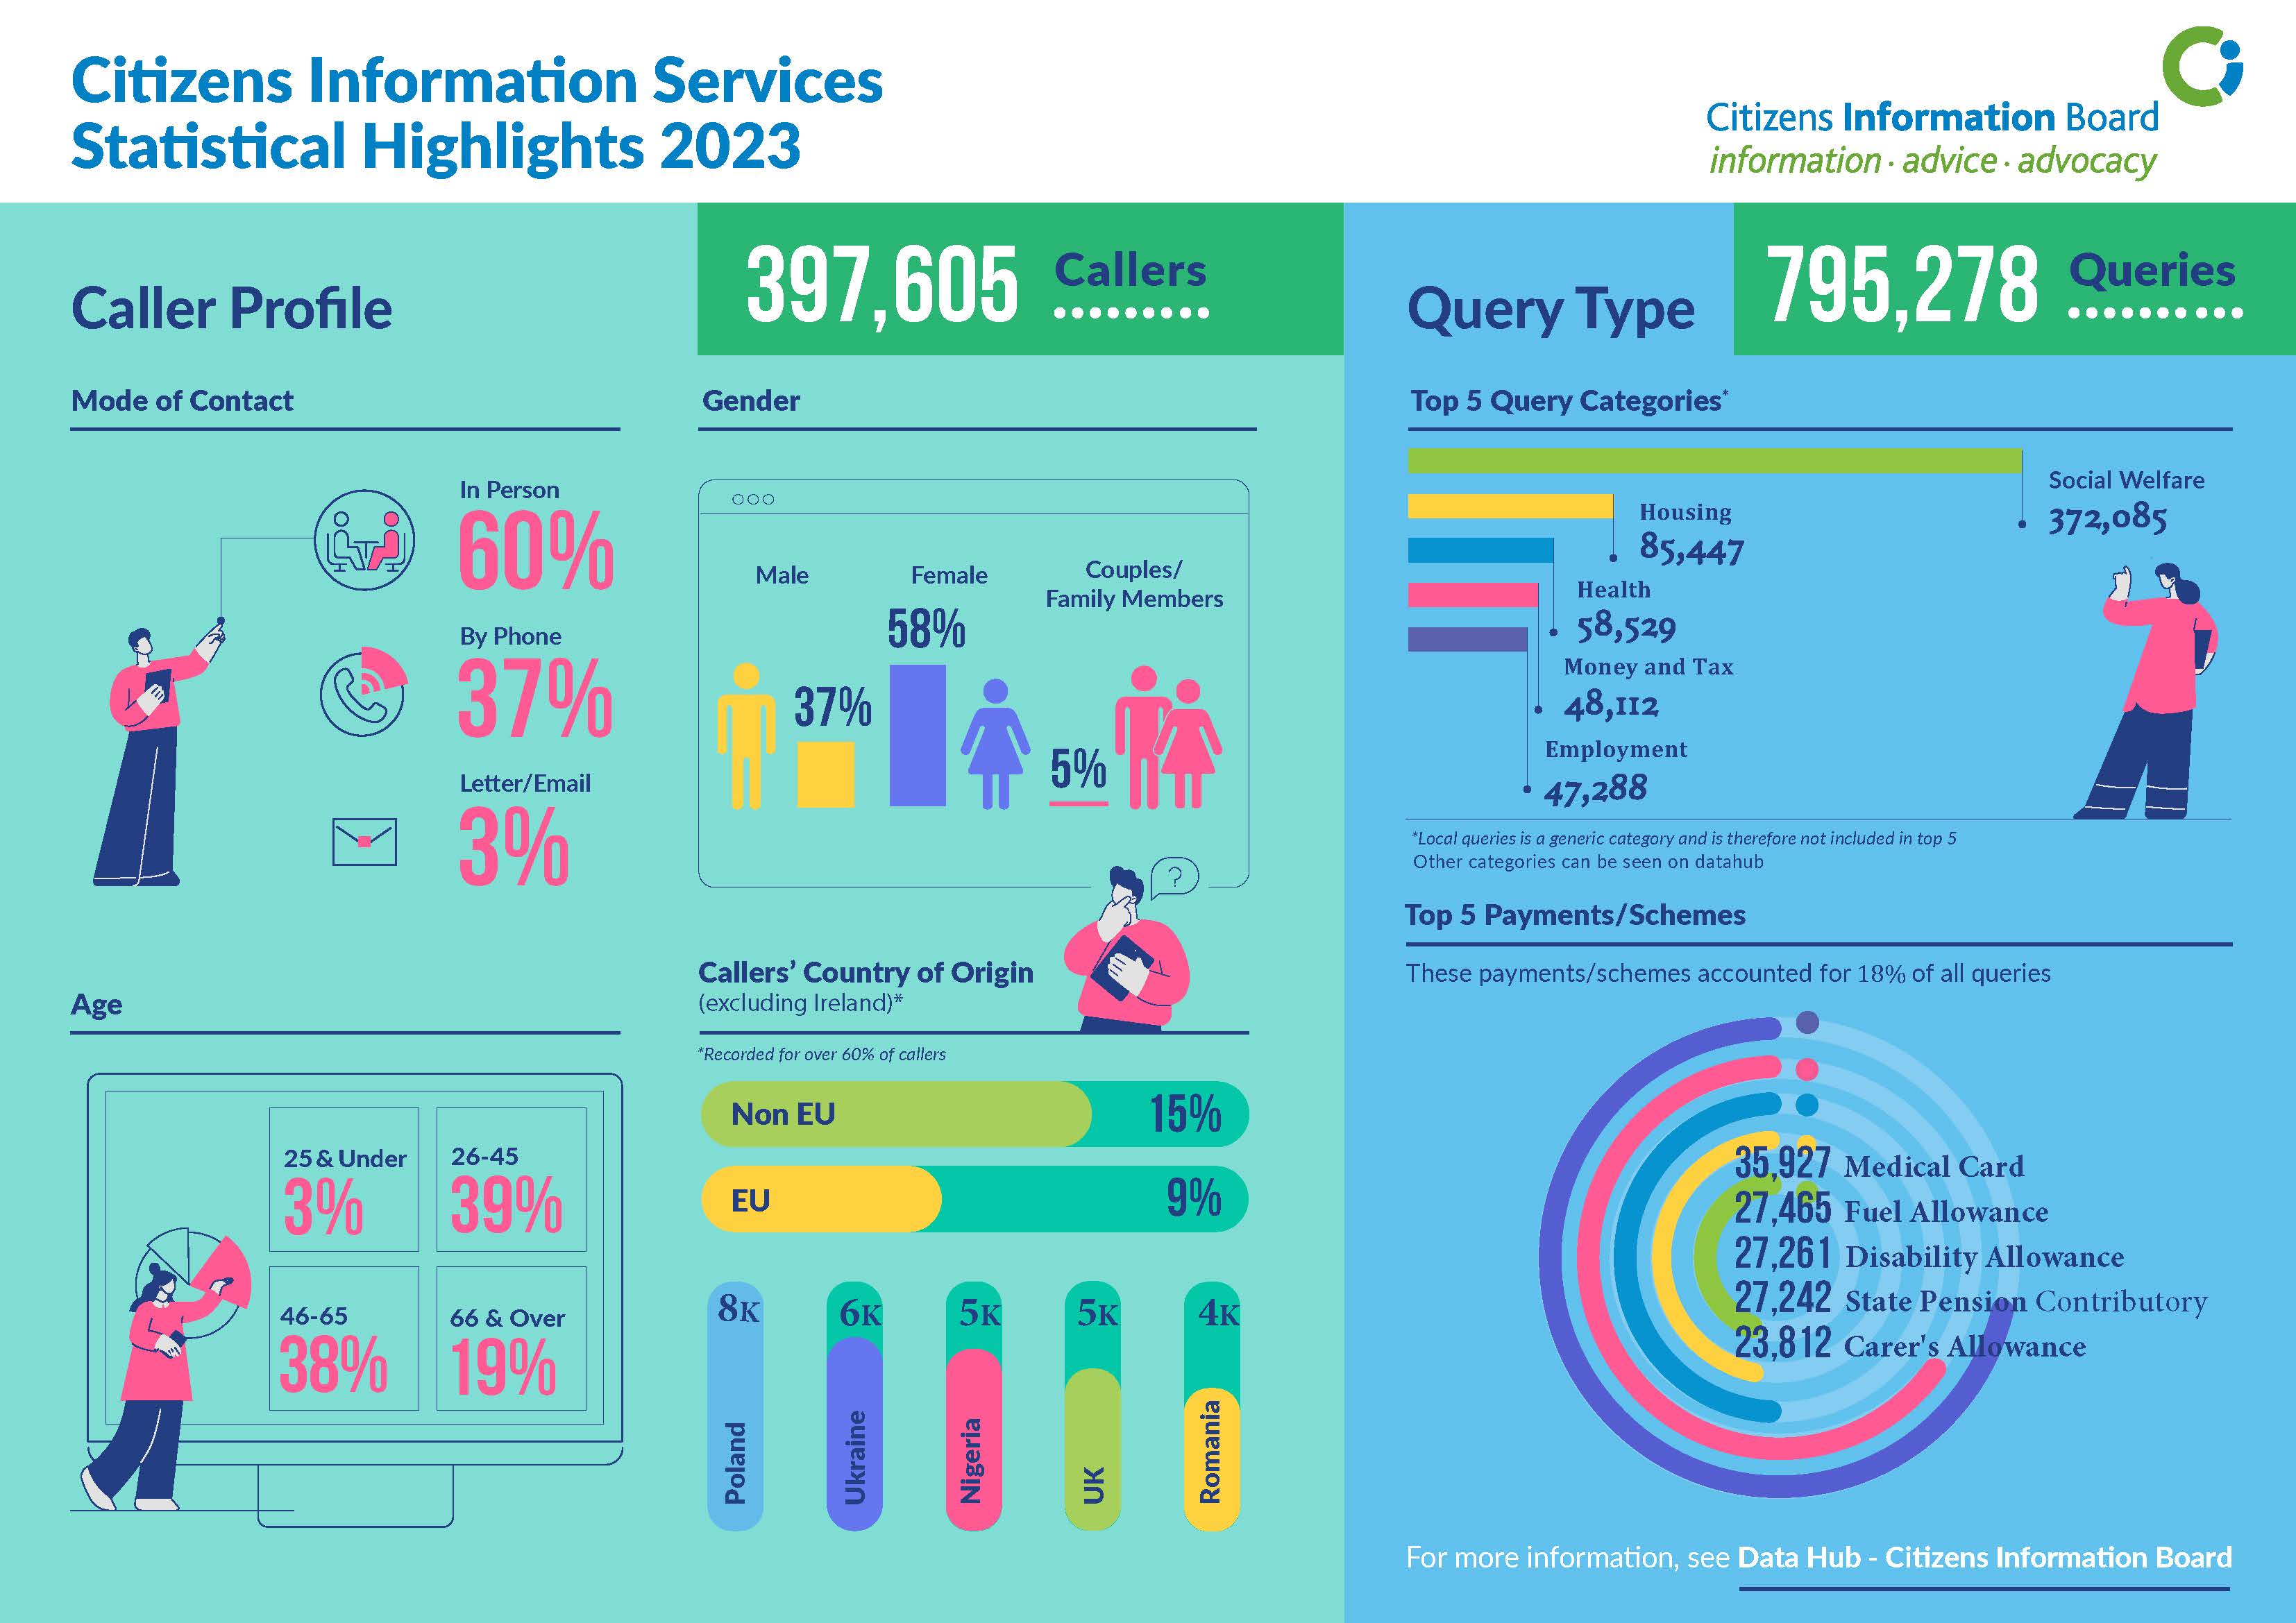
In 2023, 397,605 callers were assisted by Citizens Information Services (CISs) nationwide — an increase of 0.8% on the 2022 numbers. These callers had over 795,278 queries, a similar increase on the 2022 query levels.
The average number of callers per month nationally for 2023 was 33,134, up from 32,867 in 2022. January had the highest number of callers (37,776) and quarter one (1 January to 31 March) was the busiest quarter with 107,403 callers (27% of the calls in 2023).
View the data for Chart 1 (callers per month, 2022 and 2023)
| Month | 2022 | 2023 |
|---|---|---|
| January | 30,297 | 37,776 |
| February | 32,741 | 34,329 |
| March | 32,188 | 35,298 |
| April | 29,608 | 28,301 |
| May | 34,255 | 35,292 |
| June | 32,847 | 32,085 |
| July | 31,719 | 33,452 |
| August | 35,189 | 34,749 |
| September | 40,650 | 35,277 |
| October | 38,844 | 36,649 |
| November | 36,338 | 35,813 |
| December | 19,724 | 18,584 |

Mode of Contact
In 2023, personal callers accounted for 60% of contacts (236,661 callers). The number of personal callers increased by 44.3% on the previous year; 93% of personal callers were drop-in and 7% were appointments. Telephone contact dropped by almost a third on the previous year and is no longer the most widely used form of contact. Letter/email contact also dropped 20%, accounting for just 3% of callers.
Gender
58% of callers to services were female (229,817), 37.2% were male (147,768) and 4.6% were couples/family members (18,420). Females continue to account for the majority of callers, but the number of female callers dropped 3.8% while male caller numbers increased by 5.2%. With the addition of family members this year to the Couples category, it increased by 42% and may account for some changes in caller profile numbers.

Age
Age was recorded for almost 68% of callers in 2023. The 26-45 and 46-65 age categories contacted CISs at similar rates, 39.1% and 38.3% respectively. The 26-45 category contacted CISs most in 2022 at 42.5%; in 2023 the numbers decreased by 5.2% (105,295 callers). The 46-65 age group grew by 9.4% (103,261 callers), and the 66 and overs contacted 10.6% more in 2023, representing 19.44% of total callers (52,360 callers).
Specific Needs
Almost 14% (54,684 callers) to CISs in 2023 had 74,033 specific needs identified by information officers. 41.5% of callers where there was a specific need related to language — an increase of 22.5% on the previous year. The number of distressed clients who contacted CISs was up over a third in 2023. Nearly 11,000 callers had issues with IT access and digital literacy problems, and almost 40% of these came from the 66 and over age group.
View the data for Chart 5 (top specific needs, 2023)
| Specific Need | Needs recorded |
|---|---|
| Language | 22,707 |
| Distressed Client | 11,676 |
| Literacy | 7,248 |
| Digital Literacy | 5,942 |
| No online/IT access | 5,049 |
Nationality / Country of Origin
Country of Origin was recorded for 62% of callers (245,954) in 2023. 24% of callers' country of origin was outside Ireland (59,119). Callers from Ireland accounted for 76% of callers (186,835). Callers from Poland (8,385) and Ukraine (6,141) were the highest groups whose country of origin was outside Ireland.
Non-EU callers continue to increase, accounting for 15.17% of callers to CISs. Between 2022 and 2023 there was a 12.4% increase (to 37,307 callers). EU callers also increased in 2023, growing by 14% to 21,812 callers.
| Rank | Under 25 | 26-45 | 46-65 | 66 and Over |
|---|---|---|---|---|
| 1 | Ukraine | Poland | Poland | United Kingdom |
| 2 | Poland | Ukraine | United Kingdom | Ukraine |
| 3 | Nigeria | Nigeria | Ukraine | Poland |
| 4 | Romania | Romania | Nigeria | Lithuania |
| 5 | Syria | Bangladesh | Romania | United States of America |
Under 25
- Ukraine
- Poland
- Nigeria
- Romania
- Syria
26-45
- Poland
- Ukraine
- Nigeria
- Romania
- Bangladesh
46-65
- Poland
- United Kingdom
- Ukraine
- Nigeria
- Romania
66 and Over
- United Kingdom
- Ukraine
- Poland
- Lithuania
- United States of America
Query Categories
There were 795,278 queries to CISs in 2023 — a slight increase of 0.8% on the previous year. People who contact CISs often have more than one query for information officers; in 2023 the query/caller ratio was 2.00, the same as 2022.
The document below contains the five highest query categories presented to services by members of the public in 2023: Social Welfare, Housing, Health, Money and Tax and Employment. It features tables with query numbers, trends, and caller profile details.
Query Categories 2023 (Word document)
Query Categories 2023 (PDF)
Using a mouse or touch, you can click a box to enlarge it (right click, or press and hold on mobile, to minimise). The full figures for every category are also in the data table below the chart.
View the data for Chart 7 (queries by category, 2023)
| Query category | Queries | Share of all queries |
|---|---|---|
| Social Welfare | 372,085 | 46.8% |
| Housing | 85,447 | 10.7% |
| Health | 58,529 | 7.4% |
| Local | 50,364 | 6.3% |
| Money and Tax | 48,112 | 6.0% |
| Employment | 47,288 | 5.9% |
| Moving Country | 37,367 | 4.7% |
| Justice | 20,161 | 2.5% |
| Travel and Recreation | 19,820 | 2.5% |
| Birth, Family and Relationships | 18,101 | 2.3% |
| Education and Training | 14,018 | 1.8% |
| Consumer Affairs | 11,733 | 1.5% |
| Death and Bereavement | 5,546 | 0.7% |
| Government in Ireland | 4,885 | 0.6% |
| Environment | 1,441 | 0.2% |
Query Trends
Social Welfare Queries
Social Welfare was the highest query category, representing 46.8% (372,085 queries). Extra Social Welfare Benefits was the most queried sub-category (63,144 queries) and accounted for 17% of all SW queries. Schemes and payments in this category saw a drop of 10.4% on 2022 levels.
Fuel Allowance dropped by 16.6% and the Household Benefits Package by 9.6%.
Disability & illness payment queries remained at a similar level to 2022; disability allowance queries increased by 10.2%, illness benefit queries decreased by 9%.
Queries relating to payments for older people increased by 13%. State pension contributory queries increased by 9.1%, and state pension non-contributory queries increased by 9.6%.
Carer's queries decreased slightly by 1.7% — carer's allowance queries decreased by 5.7%, domiciliary carer's allowance increased by 8.7%. Half-rate carer's allowance increased by 49.8%; this scheme was added to the CIS system in Q4 2021 as a separate payment and has seen steady growth in query numbers.
Housing Queries
85,447 Housing queries were dealt with in CISs in 2023, an increase of 13.3% on the previous year. Year on year, housing query numbers have been increasing and are almost at pre-COVID levels.
Over 50% of housing queries were related to Local Authority and Social Housing. Housing grants and schemes increased by 19% and home energy grants more than doubled between 2022 and 2023.
Renting a Home (Private Rental Accommodation) queries increased by 3.6%. Buying a Home increased by 24.2% (2,323 queries).
Health Queries
Health service queries increased overall by 2.6%. Queries about GP services increased by 19.1%, and fair deal & home care package related enquiries increased by 13.2%.
Other Queries
Money and Tax queries increased by 15.8% on the previous year. Income Tax Credits and Reliefs increased by 20.4% and Income Tax queries increased by 10.4%. Revenue Online queries increased by 31.8%, with information officers assisting clients with digital literacy and access problems.
Employment related queries (47,288) dropped by 4.8%. Queries relating to ‘Employment Rights and Conditions’ decreased by 9.7%. At its recent peak in 2020 there were 14,785 leave and holiday queries, and these high numbers continued in 2021 (14,590 queries), possibly related to uncertainty over how COVID-19 would affect entitlements. In 2022 the number of related queries dropped by 39% and continued to decrease in 2023 by 41%. Queries about sick leave and sick pay schemes more than doubled, reflecting the introduction of the new statutory sick pay scheme.
Moving country queries (37,367) decreased by nearly 11%. Queries relating to Irish citizenship increased by 5.4% and those relating to Visas increased by 18.3%. A decrease of 73.5% was seen in asylum seeker/refugee – Ukrainian queries as their circumstances became more settled.
Justice queries (20,061) increased by 9.5%. Queries relating to legal aid and advice increased by 4.4%, civil law queries increased by 7.5% and queries about court systems increased by 5.2%. Queries relating to laws and rights decreased by 7.4%.
Travel and Recreation queries decreased by 11.8%. Queries relating to motoring dropped by 13.2%, and those about passports decreased by 16.8% — possibly related to a clearing of processing backlogs.
Top 10 Entitlements in 2023
28.4% of all queries in 2023 were related to the Top 10 entitlements.
View the data for Chart 9 (top 10 entitlements, 2023)
| Entitlement | Queries |
|---|---|
| 1. Medical Card | 35,927 |
| 2. Fuel Allowance | 27,465 |
| 3. Disability Allowance | 27,261 |
| 4. State Pension /Contributory | 27,242 |
| 5. Carer's Allowance | 23,812 |
| 6. Local Authority/ Social Housing | 21,119 |
| 7. Household Benefits Package | 17,584 |
| 8. Jobseeker's Allowance | 16,006 |
| 9. Basic supplementary welfare allowance | 14,714 |
| 10. Illness Benefit | 14,472 |
| Rank | Under 25 | 26-45 | 46-65 | 66 and Over |
|---|---|---|---|---|
| 1 | Jobseeker's Allowance | Medical card | State Pension Contributory | Fuel Allowance |
| 2 | Medical card | Applying for local authority and social housing | Disability Allowance | Medical card |
| 3 | SUSI grant – Student Grant Scheme | Disability Allowance | Medical Card | Household Benefits Package |
| 4 | Disability Allowance | Working Family payment | Fuel Allowance | State Pension Contributory |
| 5 | Applying for local authority and social housing | Carer's Allowance | Invalidity Pension | State Pension non-Contributory |
Under 25
- Jobseeker's Allowance
- Medical card
- SUSI grant – Student Grant Scheme
- Disability Allowance
- Applying for local authority and social housing
26-45
- Medical card
- Applying for local authority and social housing
- Disability Allowance
- Working Family payment
- Carer's Allowance
46-65
- State Pension Contributory
- Disability Allowance
- Medical Card
- Fuel Allowance
- Invalidity Pension
66 and Over
- Fuel Allowance
- Medical card
- Household Benefits Package
- State Pension Contributory
- State Pension non-Contributory
Further Statistical Data
Quarterly reports for 2023 can be accessed on the CIS Data Hub.
The document below contains the five highest query categories — Social Welfare, Housing, Health, Employment and Moving Country — and shows the number of queries relating to the various schemes, payments and entitlements in each sub-category in 2023.
Query Categories 2023 (Word document)
Query Categories 2023 (PDF)